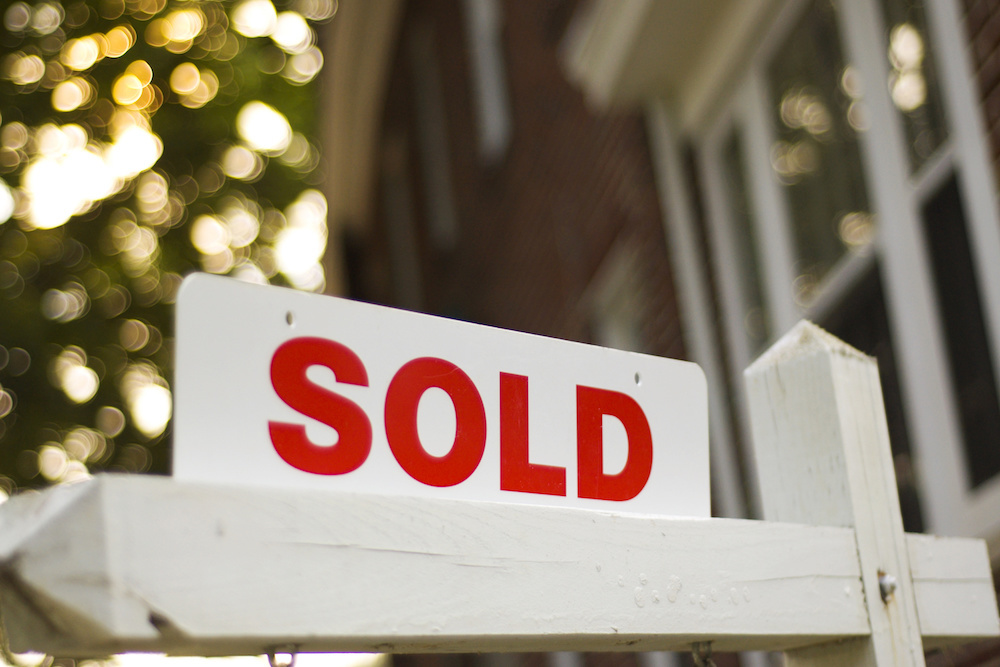
In February 2017, there were 26 homes sold, with a median sale price of $96,950 - a 41.9% decrease over the $167,000 median sale price for the same period of the previous year. There were 35 homes sold in Shaker Heights in February 2016.
The median sales tax in Shaker Heights for the most recent year with available data, 2016, was $8,232, approximately 8.5% of the median home sale price for February 2017.
The following table compares Shaker Heights to other Cuyahoga County cities with similar median sales prices in February 2017:
| City | Feb. 2017 Home Sales | Feb. 2016 Home Sales | % change (Total Home Sales) | Feb. 2017 Median Sales Price | Feb. 2016 Median Sales Price | % change (Median Sales Price) |
|---|---|---|---|---|---|---|
| Middleburg Heights | 7 | 7 | 0% | $115,000 | $130,000 | -11.5% |
| Broadview Heights | 10 | 18 | -44.4% | $108,100 | $169,000 | -36% |
| Berea | 19 | 12 | 58.3% | $105,000 | $121,500 | -13.6% |
| Parma Heights | 11 | 11 | 0% | $99,900 | $64,100 | 55.9% |
| Lyndhurst | 18 | 17 | 5.9% | $97,250 | $118,000 | -17.6% |
| Shaker Heights | 26 | 35 | -25.7% | $96,950 | $167,000 | -41.9% |
| Brook Park | 15 | 22 | -31.8% | $89,000 | $91,750 | -3% |
| Richmond Heights | 8 | 8 | 0% | $87,450 | $67,750 | 29.1% |
| Parma | 79 | 68 | 16.2% | $79,500 | $77,500 | 2.6% |
| Newburgh Heights | 1 | 0 | - | $79,300 | $0 | - |
| Bedford Heights | 5 | 3 | 66.7% | $77,000 | $86,000 | -10.5% |


 Alerts Sign-up